SIT-UP: Smart Integrated Technology for Upright Posture
The SIT-UP system represents a novel approach to posture correction by integrating computer vision with vibratory and auditory feedback, utilizing a height-adjustable standing desk capable of autonomous adjustments. It aims to promote healthier postural habits while minimizing disruption to users’ workflows. The study evaluated the system’s ability to improve posture through a user study with three groups: control, passive and active interventions. Adjusting the desk height when bad posture was detected proved to be an effective strategy. Future research could focus on long-term studies and personalized calibration for individuals with specific needs.
Introduction. Posture is how you hold your body. Humans did not evolve to sit for hours in unnatural positions working at a desk. As people tire mentally, they pay less attention to their posture. Working for long hours can cause unconscious slouching which reinforces poor postural habits. Beyond poor aesthetics, slouching or slumping can misalign the skeletal system, wear at your spine, cause breathing issues, and many other problems. It is in your best interest to maintain good posture.1,2,3
Related work. Our lifestyles don’t make this any easier. According to a recent study, 80% of the jobs in the U.S. involve prolonged computer or mobile device use.4,5,6 The risks linked to sedentary behavior are now ever present. Numerous posture correction systems have surfaced, including wearable sensors and ‘smart chairs’, but none have taken off. Challenges such as cognitive load and workflow disruptions continue to persist. There is a need for minimally disruptive, adaptive systems that can be integrated into our daily workflows. Our system promotes healthier postural habits without compromising productivity.7,8,9
SIT-UP has three core components:
- Computer vision system: Built using the MediaPipe Pose library, a camera positioned in front and to the side of the user captures real-time posture data.
- Feedback mechanisms: Vibrations and auditory feedback (ding sounds) act as prompts for users to correct their posture.
- Height-adjustable desk: Equipped with linear actuators and a control unit.

Fig. 1. Posture Measurements Collected: Side and front profiles.
Experimental Design
Fifteen participants were recruited and divided into three groups:
- Control group: A conventional setup without any interventions.
- Passive group: Received vibrations and sounds delivered via push notifications, triggering after 10 seconds of continuous postural deviation. The sequence of the two modalities was randomized to eliminate order effects.
- Active group: The desk moved up if the user leaned forward and the desk height was below the maximum threshold. Conversely, the desk moved down if the user leaned back and the desk height was above the minimum threshold.
Each session lasted for 40 minutes, consisting of a 5-minute calibration period, 30 minutes of the user working on their laptop, and a 5-minute post-session evaluation. During the first five minutes, a pre-study questionnaire was administered to gather user perceptions and experiences.10
- Demographic information: Age, gender, occupation, hours spent at a computer daily.
- Baseline posture and comfort (1-5 scale): How would you rate your current posture while working? How comfortable do you feel during prolonged computer use?
- Expectations (free response): What do you expect from this posture correction system?
Posture data was continuously logged using the CV system. It detected postural deviations using features such as head tilt, shoulder alignment, and spinal curvature. When deviations exceeded a 10-second threshold, one of the interventions – desk, vibration, sound – was triggered.
Once the 35-minute mark passed, a few wrap-up questions were asked:
- Perceived effectiveness (1-5): How effective do you think the system was in improving your posture?
- Perceived productivity (1-5): How much more or less productive did you feel while using the system?
- Perceived intelligence (1-5): How smart or adaptive did you find the system?
- Comfort (1-5): How comfortable did you feel during the session?
- Bodily fatigue (1-5): How fatigued do you feel compared to before using the system?
- Intrusiveness (1-5): Did you find the system intrusive to your workflow?
- Open-ended feedback: What did you like most about the system? What improvements would you suggest for future studies?
Computer Vision System
A dual-camera system uses one camera positioned in front and another at the side.
Fig. 2. Live demonstration: Teammates Justin Wit and Anwesha Gorantla demonstrating the SIT-UP system's dual camera setup.
The front camera measures leaning and level misalignment of shoulders. The side camera identifies head posture and slouching. Posture is evaluated every 0.5 seconds and key metrics are logged, including:
- Torso inclination: Angle between hip and shoulder in 3D space.
- Spine length: 3D distance between hip and shoulder.
- Neck angle: Relative angle between ear, shoulder, and hip coordinates.
- Shoulder level: Difference in y-coordinates of left and right shoulders.
- Upper body lean: Difference in mean z-values between ear and shoulder.
- Neck_: Normalized neck angle based on thresholded neck_min and neck_max.
- Torso_: Normalized torso inclination based on thresholded torso_min and torso_max.
- Level_: Normalized level based on level_min and level_max.
- Lean_: Normalized lean based on lean_min and lean_max.
- Front Score: 40 * (1 - level_) + 60 * (1 - lean_)
- Side Score: 70 * neck_ + 30 * torso_
A composite posture score was calculated as: 55 * neck_ + 40 * torso_ + 3 * (1 – lean_) + 2 * (1 – level_). The weights prioritize neck and torso inclinations (55% and 40%, respectively). These have a stronger correlation with postural health. Lean and level are assigned lower weights (3% and 2%, respectively) as they are typically less critical. This score reflects the frequency and duration of poor posture instances, the magnitude of postural deviations, and the time spent in optimal posture ranges.
Interventions occur only when bad posture persists beyond a defined threshold and a 30-second cooldown period has elapsed. This prevents overcorrection while also addressing continuous bad posture. Our professor, Sonia Chernova, recommended we exhaustively log all posture data (“log the hell out of it”, to be precise). This allowed us to measure several behaviors, some of which are included below:
- Frequency of poor posture: Count instances where composite_score < 50
- Duration of poor posture: Tracked by bad_posture_duration variable
- Magnitude of deviations: Captured in the individual metrics (neck_, torso_, lean_, level_)
- Time in optimal range: Calculate percentage of time composite_score >= 50
- Vibration cues: Count of sent_vibration
- Sound cues: Count of sent_sound
- Desk adjustments: Count of moved_desk (not implemented yet)
- Response time: Calculate time between an intervention (sent_vibration/sent_sound) and when composite_score returns to >=50
- Posture stability: Calculate standard deviation of composite_score over time windows (e.g., 5-minute intervals)
- Intervention effectiveness: Compare average_composite_score for 1 minute before and after each intervention
- Posture breakdown: Percentage of time spent in good (score > 75), moderate (50-75), and poor (<50) posture ranges
- Spine length variability: Track changes in spine_length over time to assess slouching or stretching
- Posture recovery rate: Measure how quickly composite_score improves after dropping below 50
- Intervention necessity: Track the frequency of interventions over time to see if users improve naturally
The original control board of a commercial standing desk was replaced with an Arduino Nano BLE board and a motor driver. The motor driver uses an H-bridge configuration, which controls the desk’s direction and speed. The Arduino Nano BLE board sends signals to the H-bridge to control the direction of the motor, while the speed is preset using the variable resistor. This setup allows for precise and gradual height adjustments based on the user’s posture.
Results
Far from ideal, but only a single user was in the control group. We were not able to recruit too many participants for a pilot study of this nature. This user’s measurements were perturbed and averaged across 5 instances. The composite scores were relatively stable but exhibited a slightly downward trend as time progressed. This decline can be attributed to the natural fatigue associated with prolonged computer use.
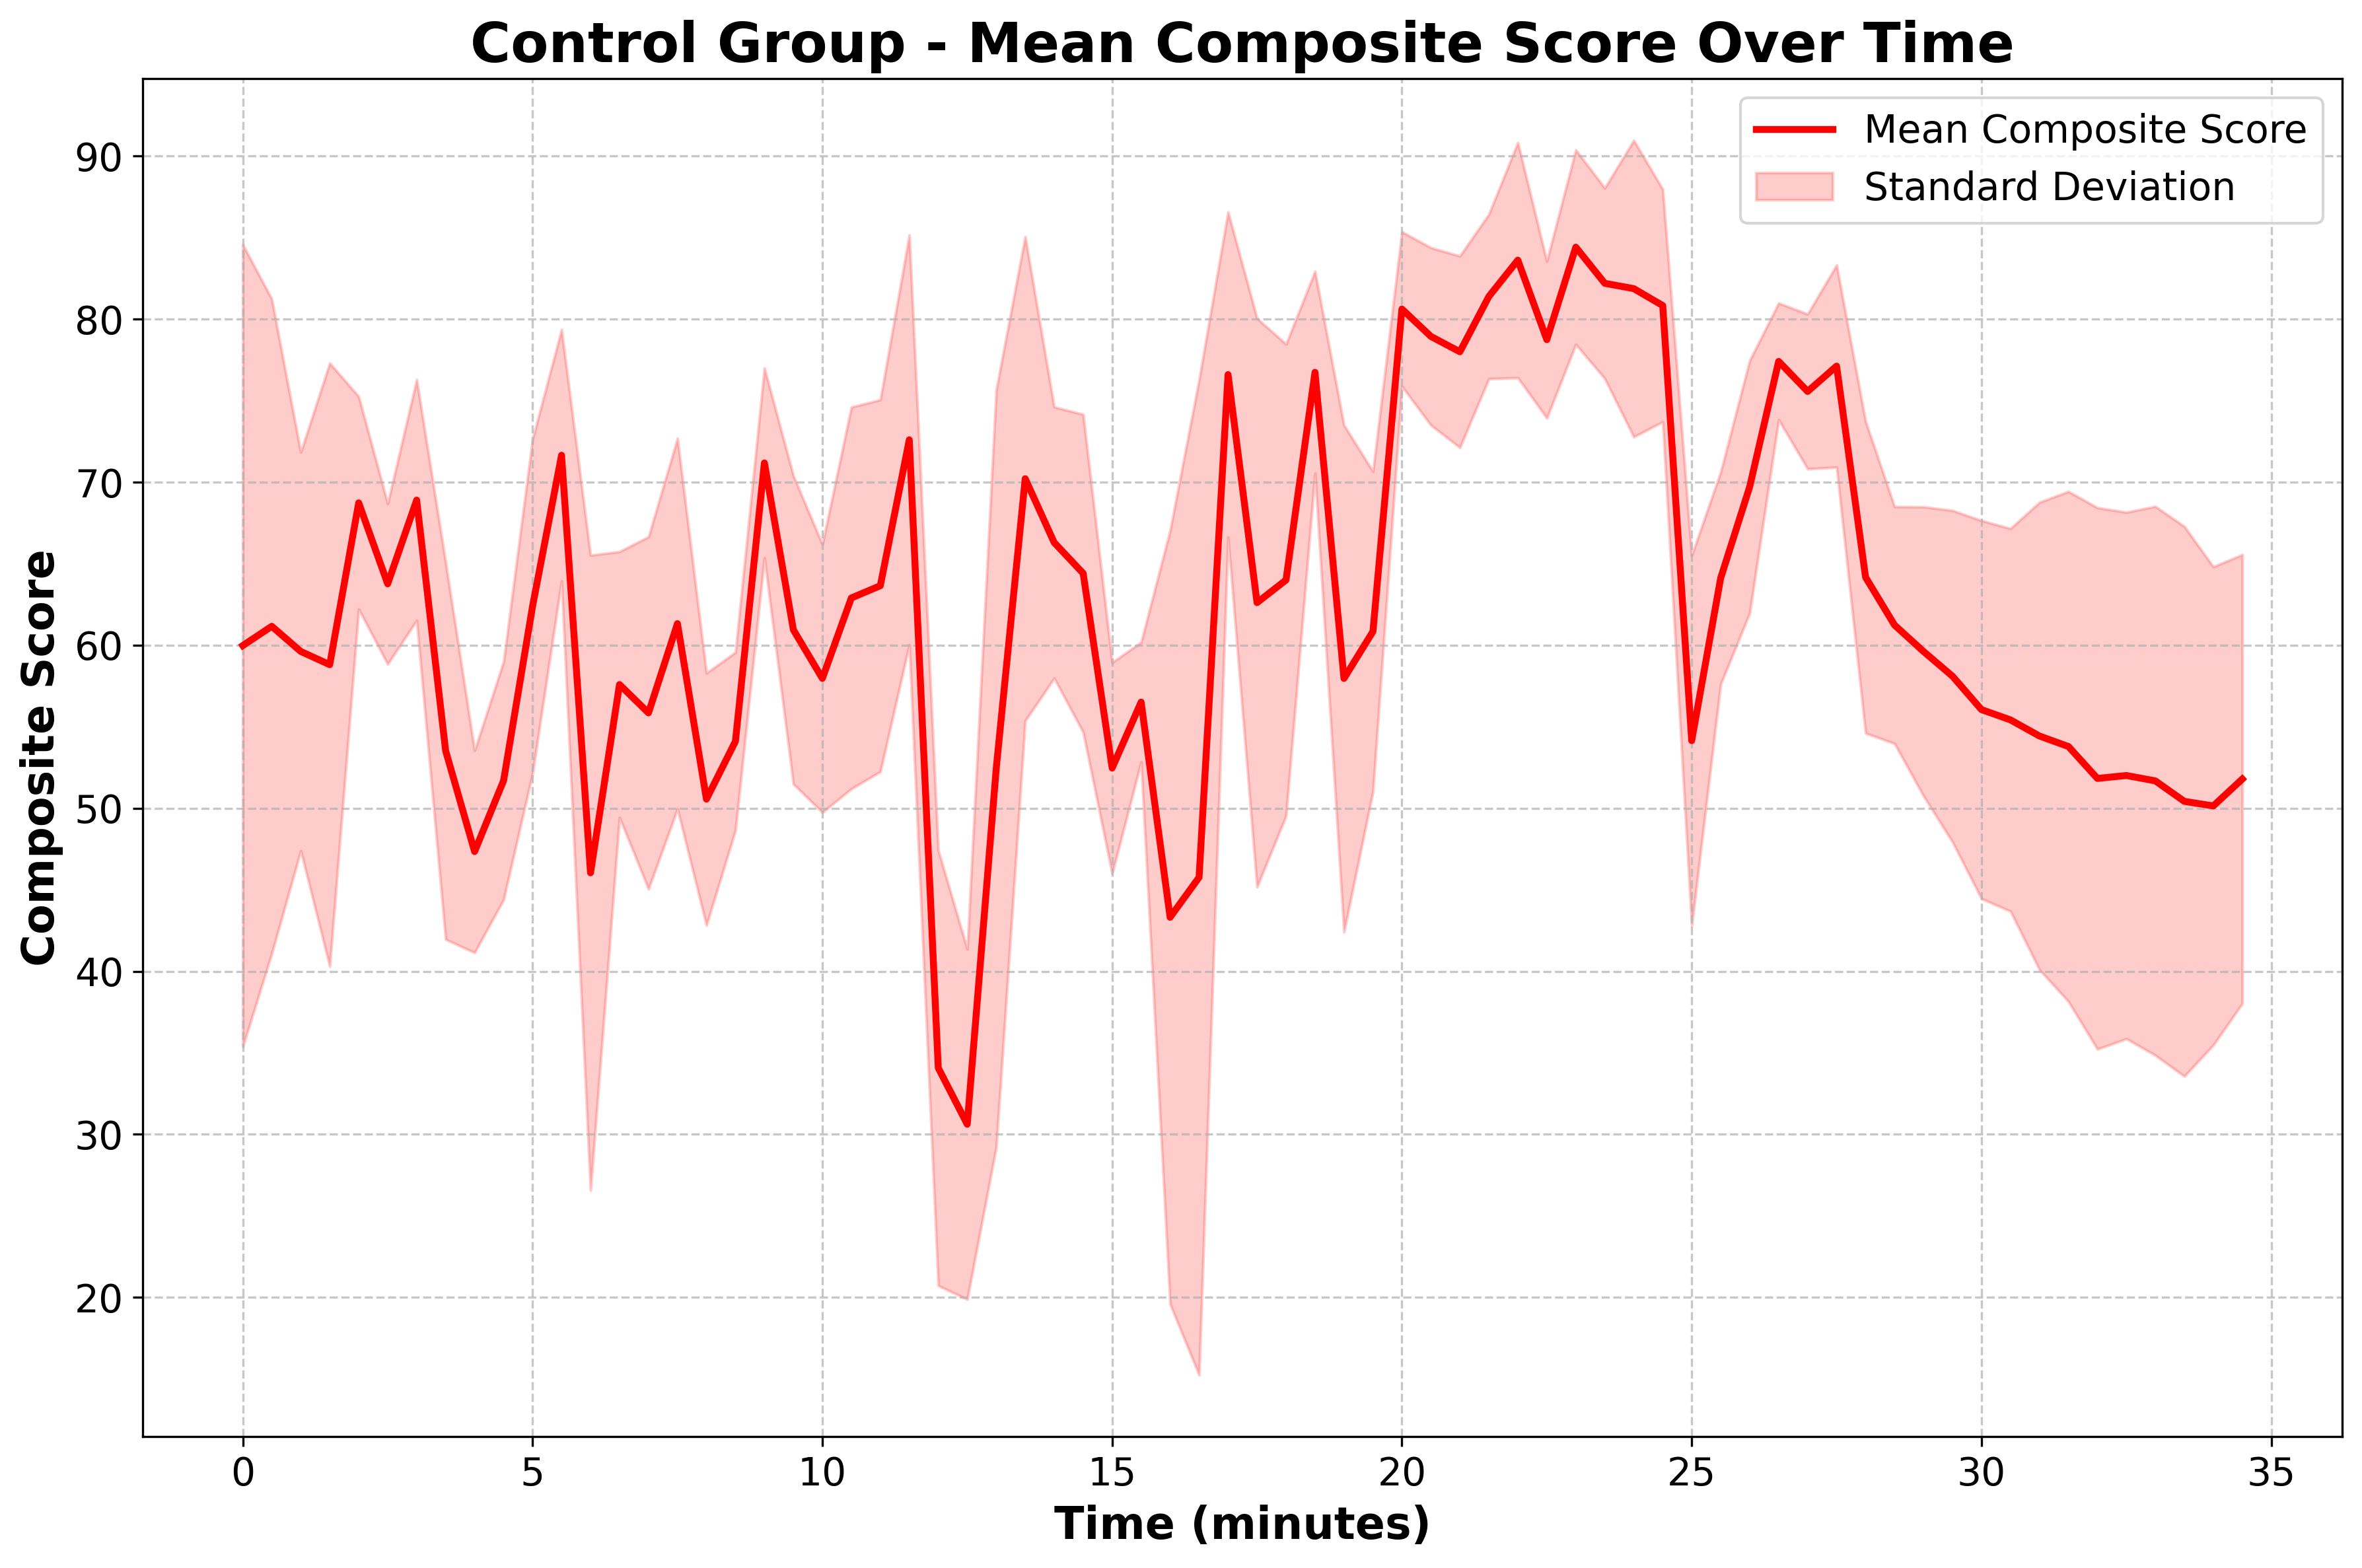
Fig. 3. Control Group: A single user was treated as the baseline, and measurements were perturbed and averaged across five instances. The control group achieved an overall mean composite score of 61.96 and a standard deviation of 16.98, with a total of 18,101 data points collected.
The passive group (n=5) exhibited more pronounced variations in posture scores, with lower mean values and wider variance bands compared to the control group. This reflects the diversity in user responsiveness to varying stimuli. Some users appeared highly responsive to auditory cues, while others barely noticed and/or struggled to interpret the feedback.
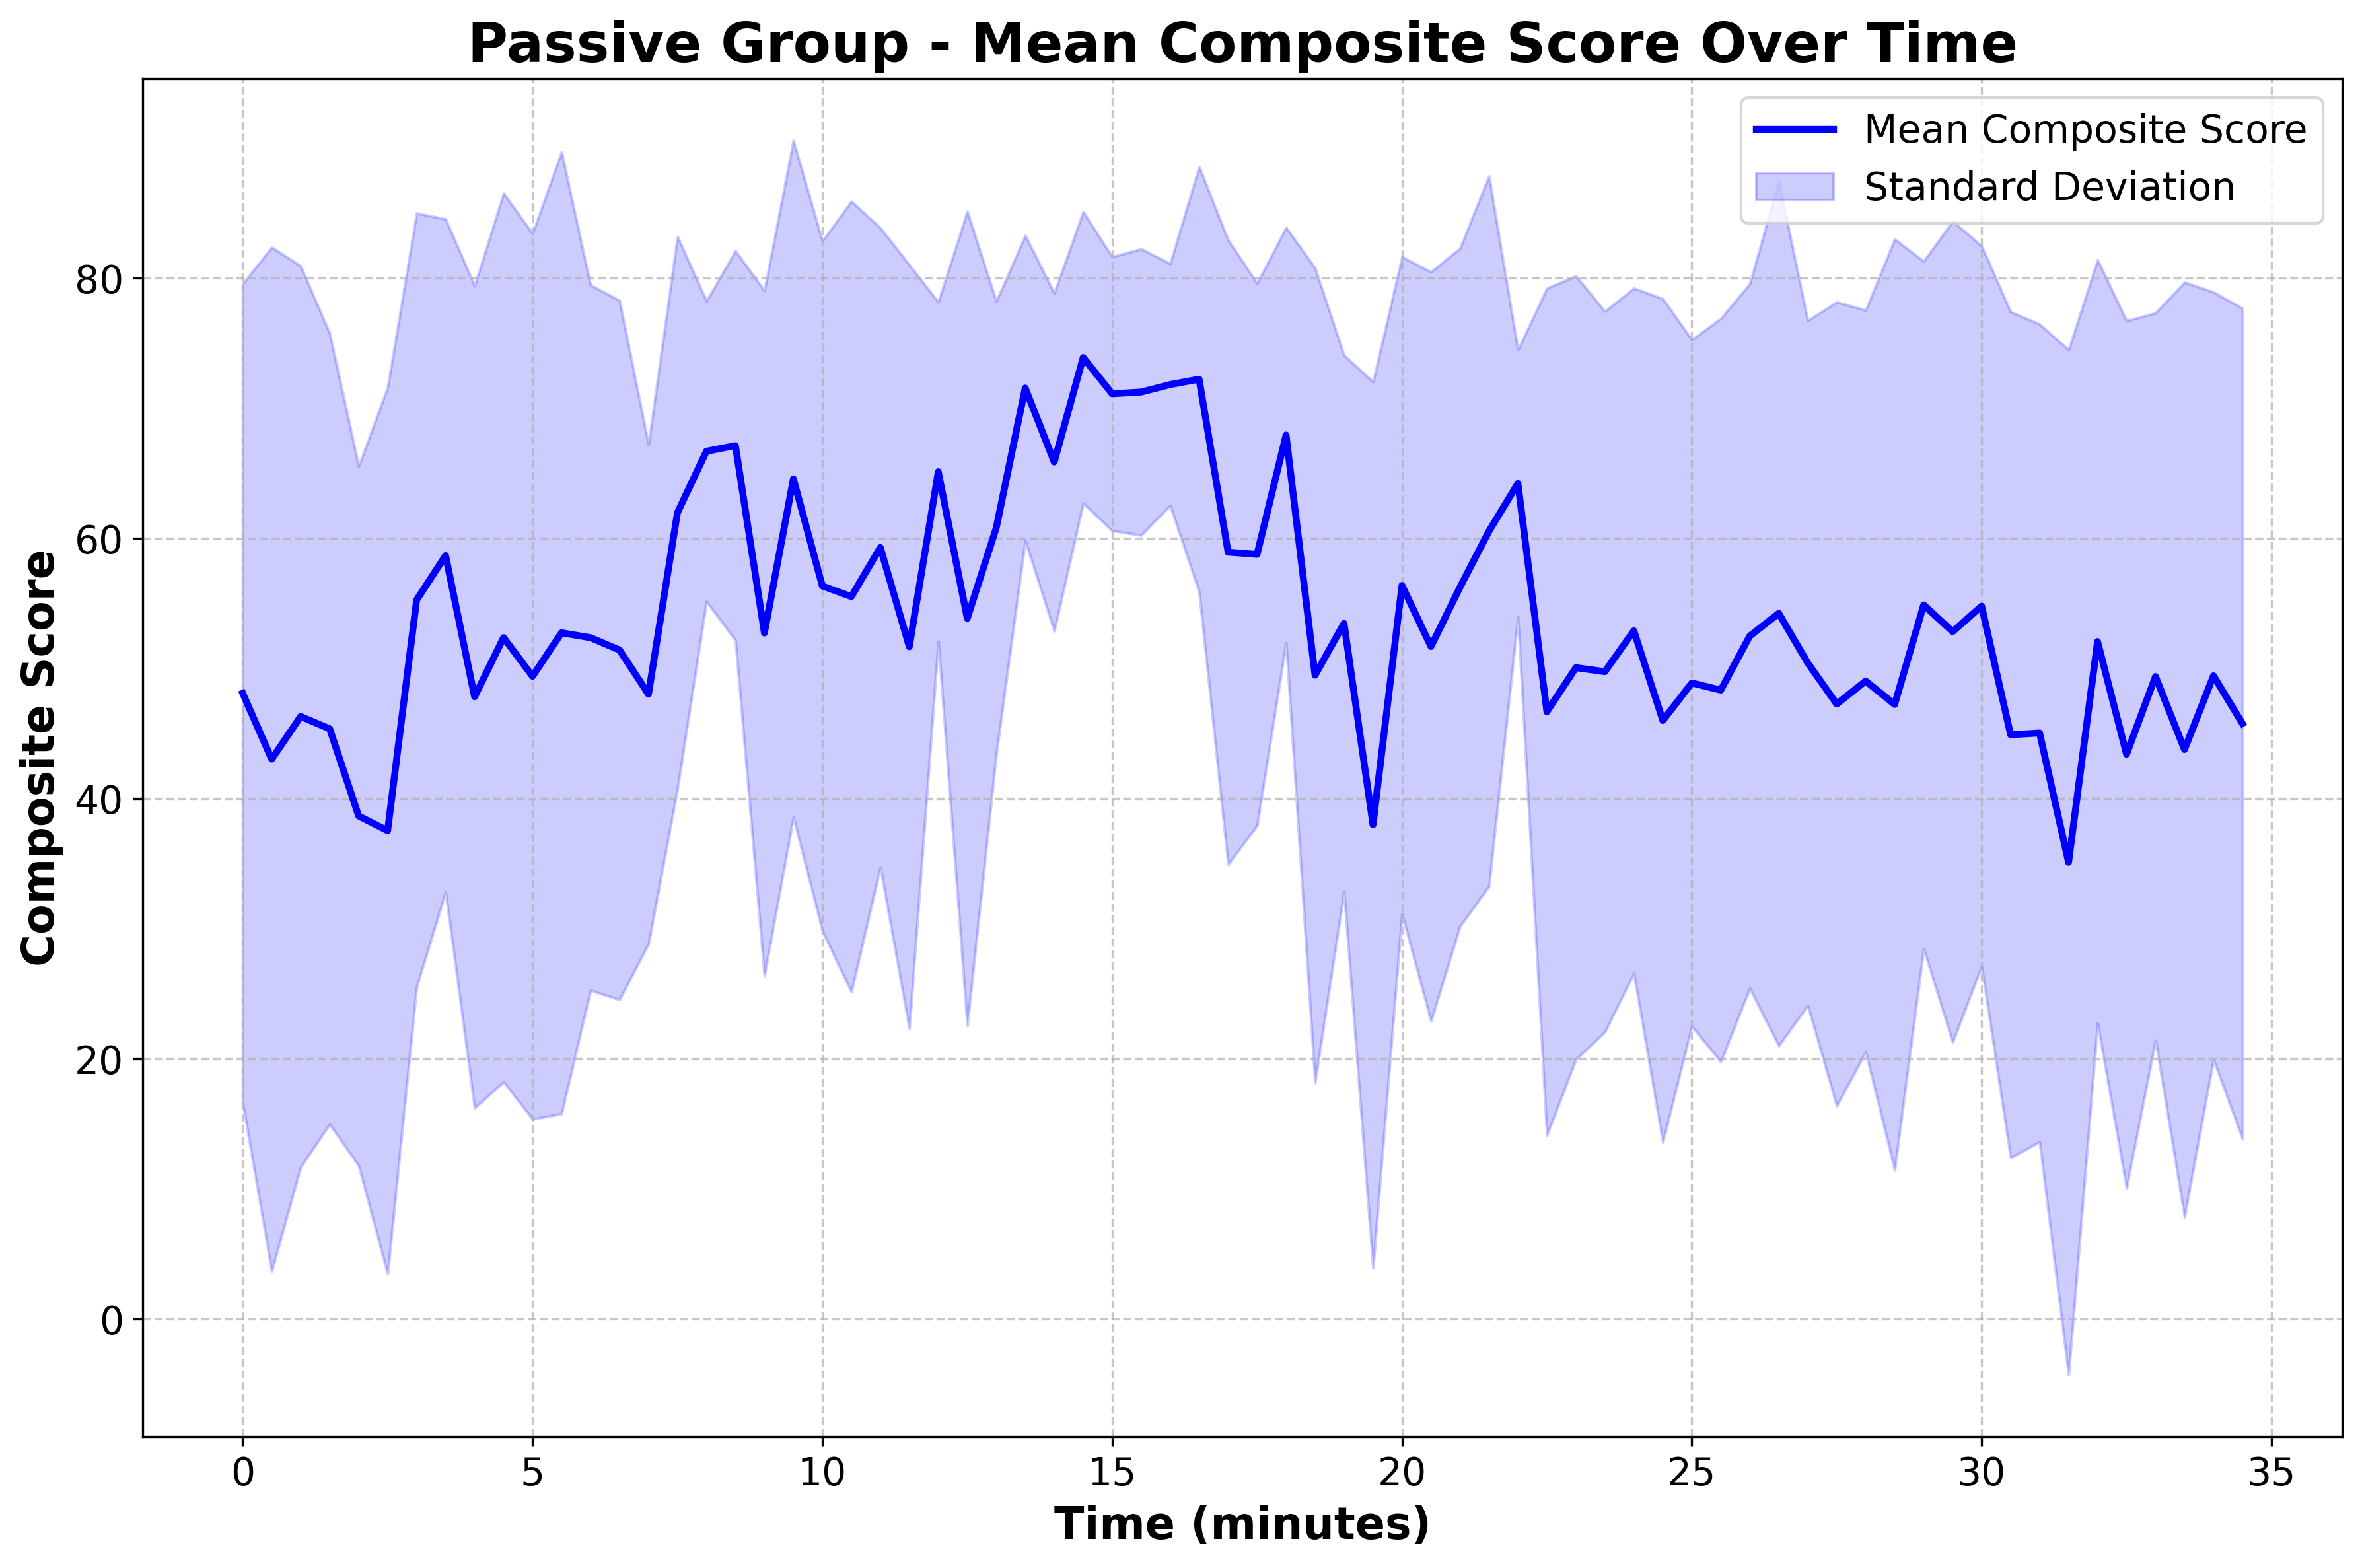
Fig. 4. Passive Group: With the passive group, the mean is lower and the variance bands are larger due to a diverse user pool. The passive group achieved an overall mean composite score of 53.65 and a standard deviation of 28.55, with a total of 17,845 data points collected.
The individual user graphs reveal deeper insights. In the left panel, the posture score for a specific user showed a noticeable decline during the vibration phase. This user confessed that the vibrations were far too subtle. In contrast, the right panel shows another user with consistently high posture scores. Either they responded well to both modalities or they have naturally great posture. It’s hard to say. This is what makes it challenging to determine which intervention – vibration or sound – is more effective.
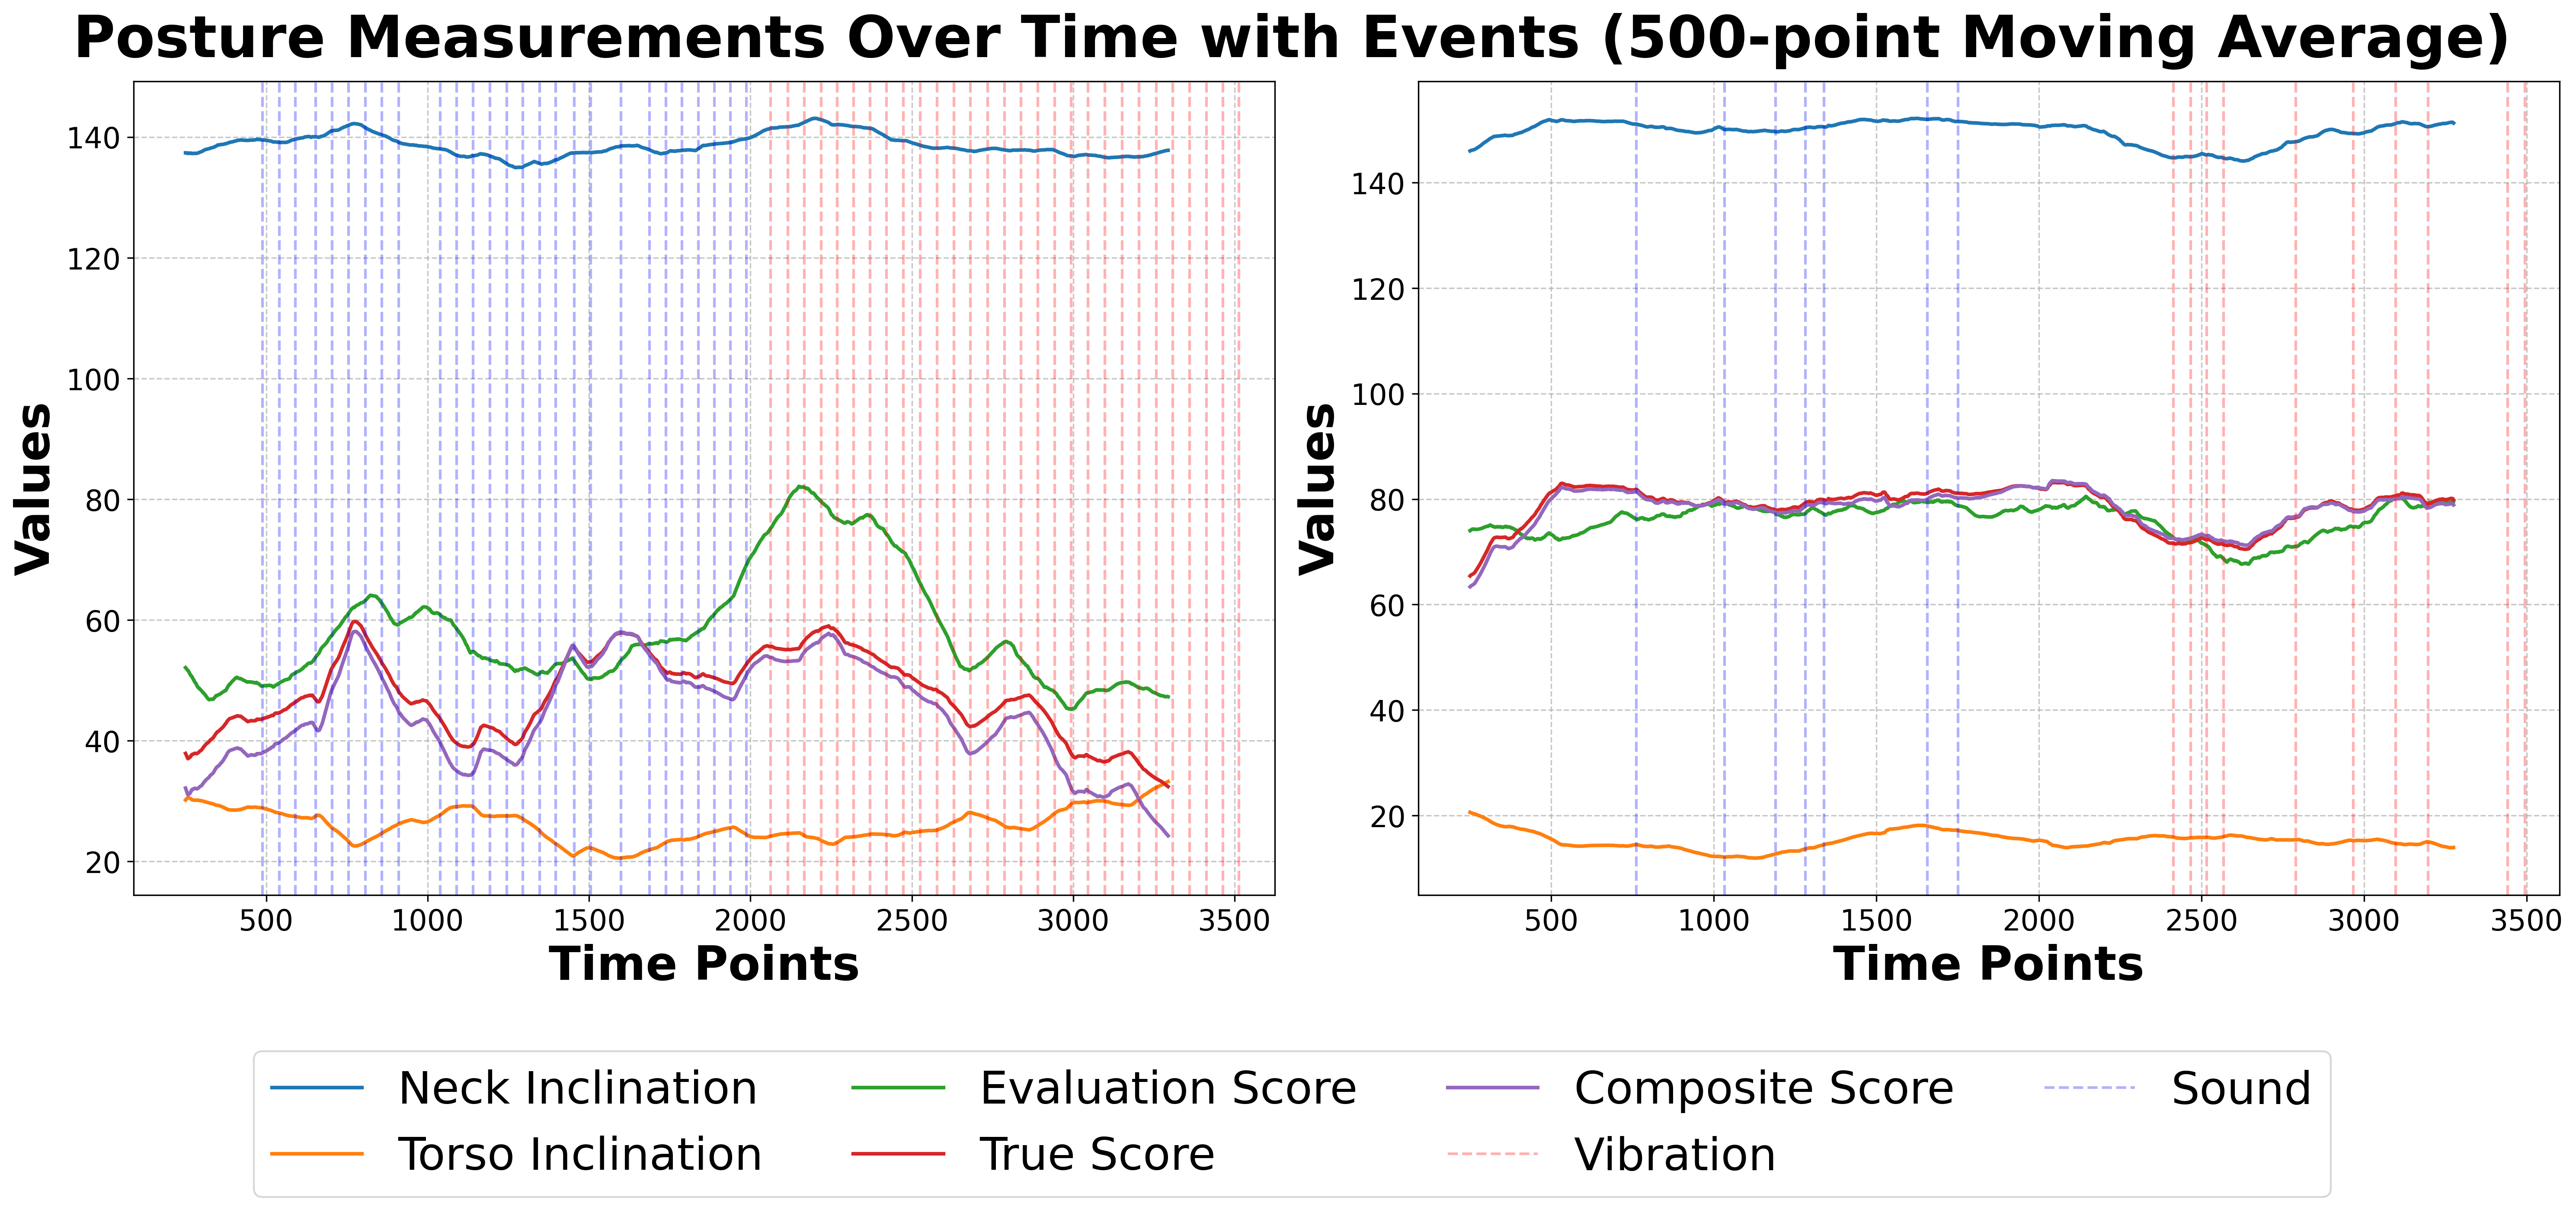
Fig. 5. Passive Group User Analysis: (Left) User with a drop in posture score during the vibration phase. (Right) User with consistently good posture across both modalities.
Box plots were created for this very purpose. The median score for sound is slightly higher than vibration, suggesting that sound may be marginally more effective at prompting behavior change.
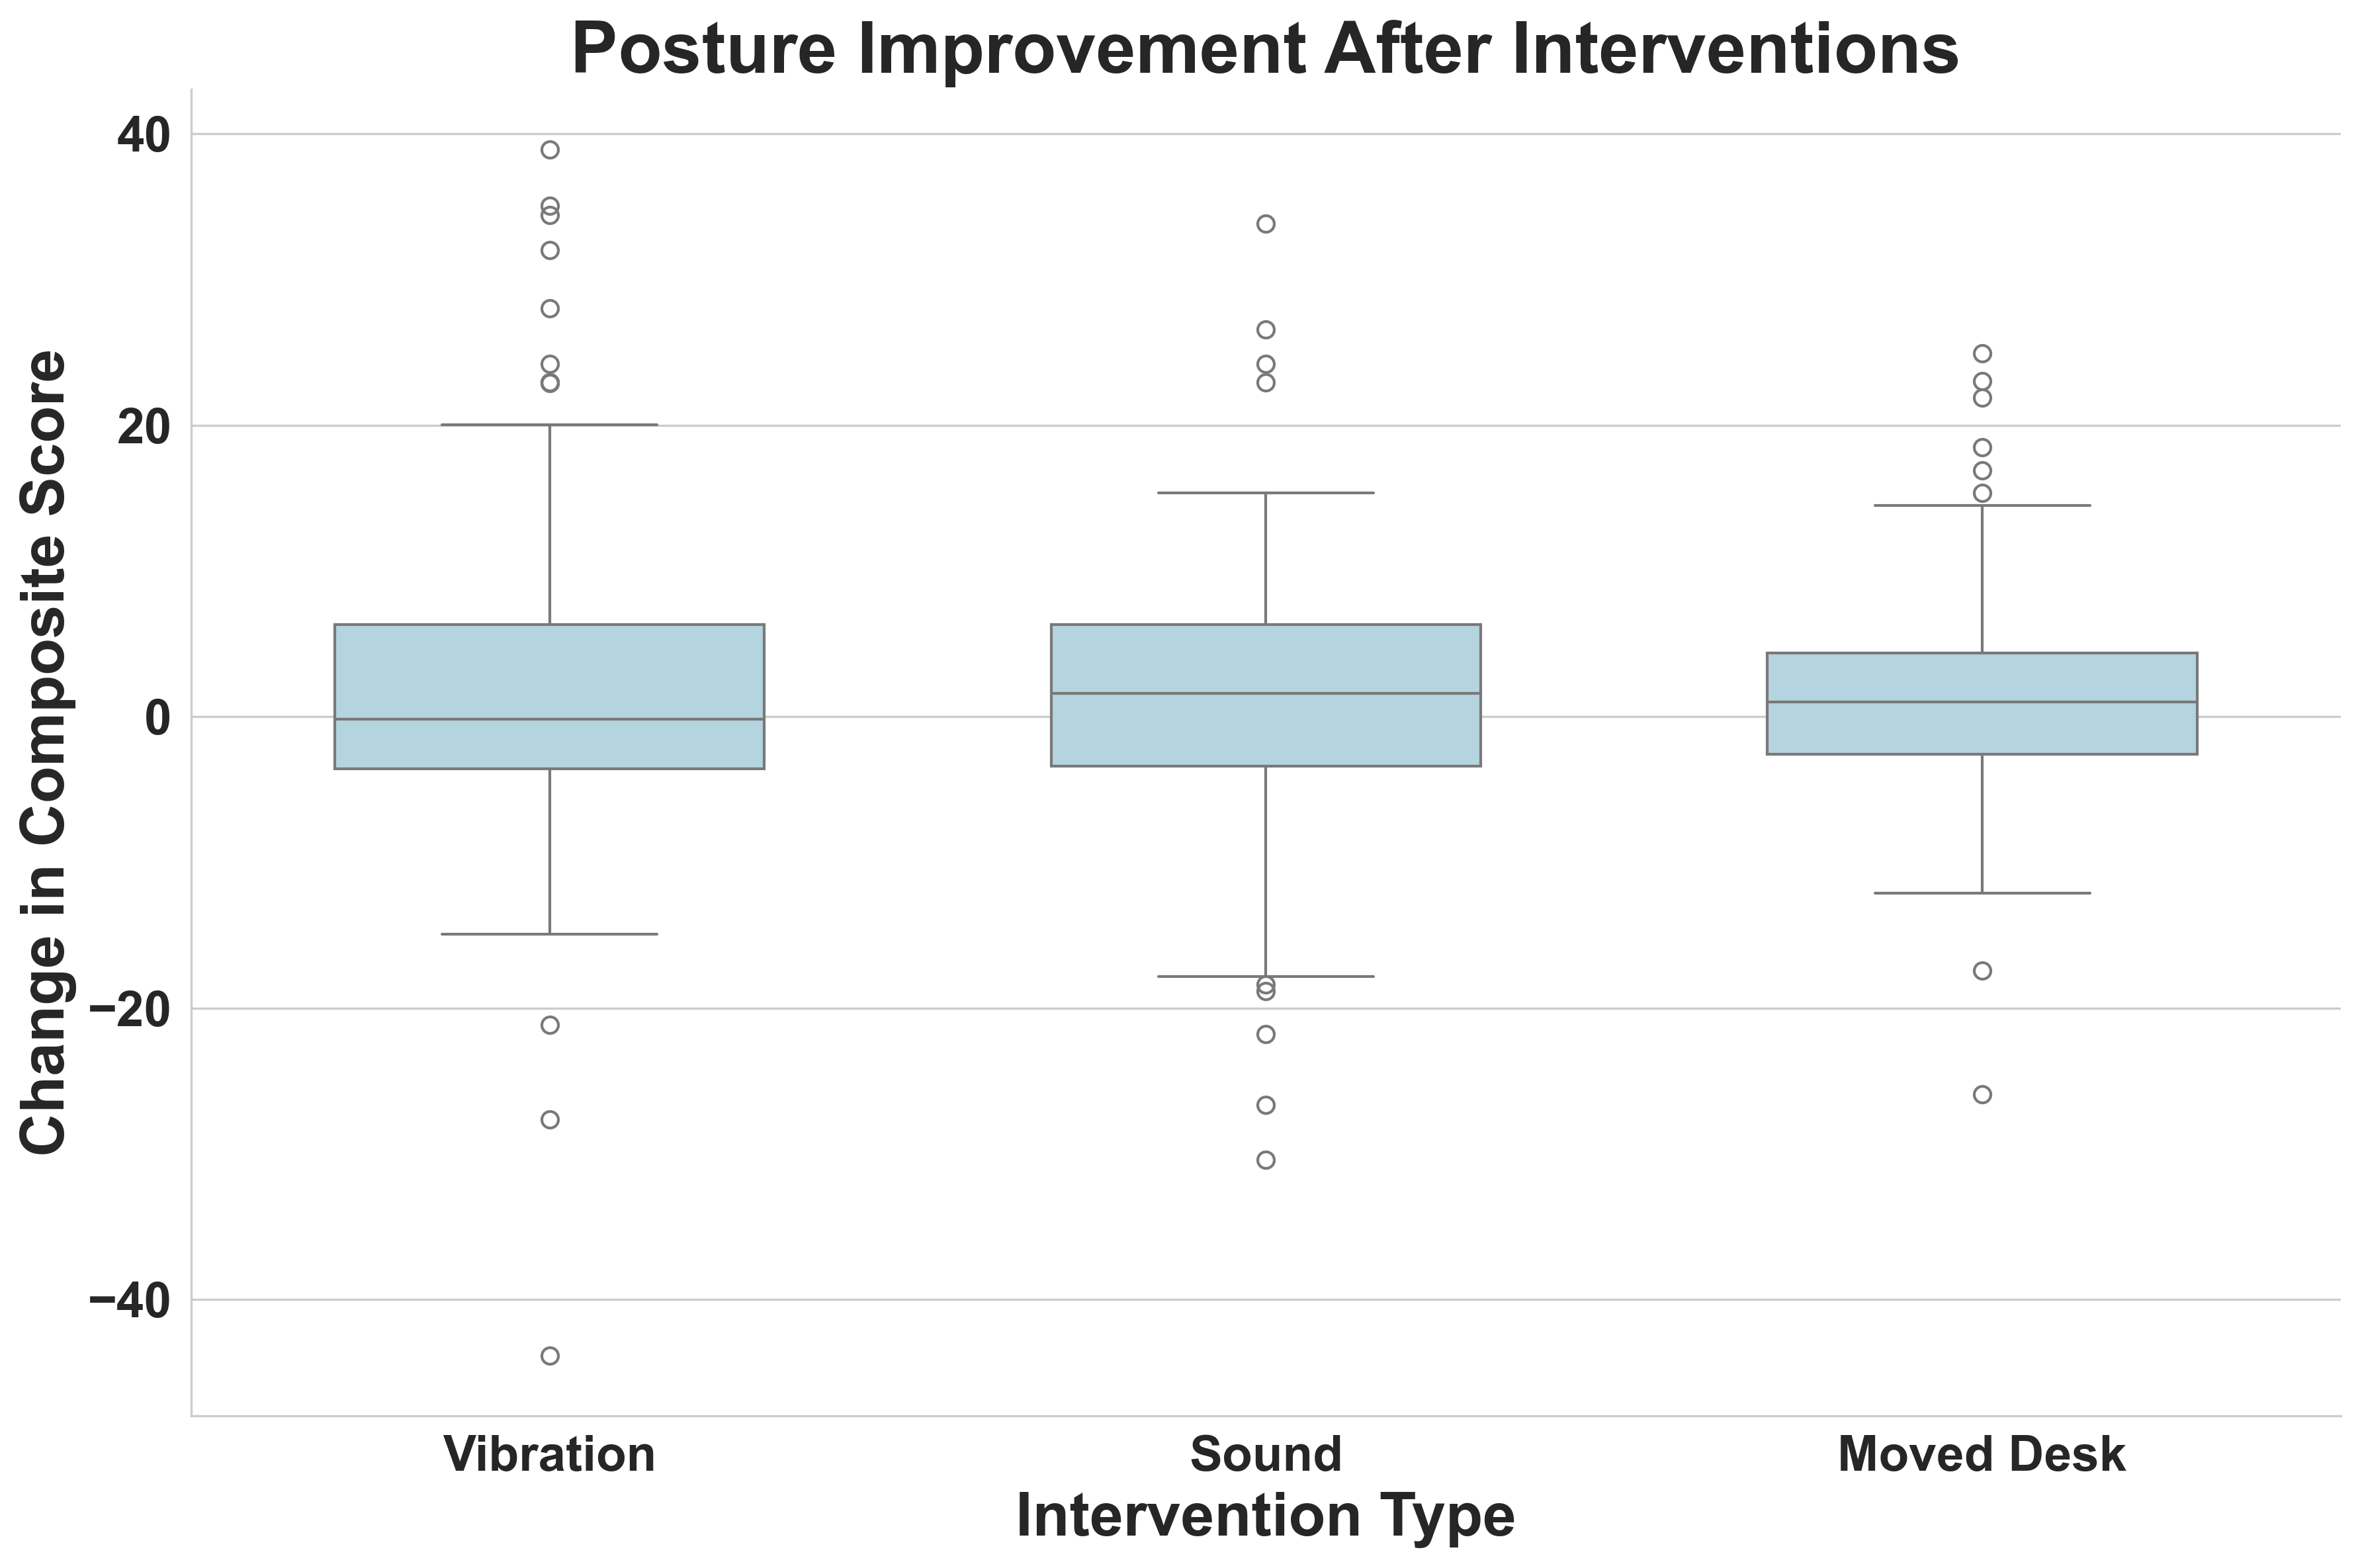
Fig. 6. Effectiveness of Intervention Modalities: Side-by-side box plots comparing the effectiveness of sound and vibration feedback for posture correction. Sound was found to be slightly more effective, with higher median scores compared to vibration.
With the active group (n=5), the mean was slightly higher, and the variance bands were narrower than the passive group. The desk height adjustments were more effective than the passive interventions. It turns out that the mean score was lower than the control group likely due to the novel medium and/or user differences.
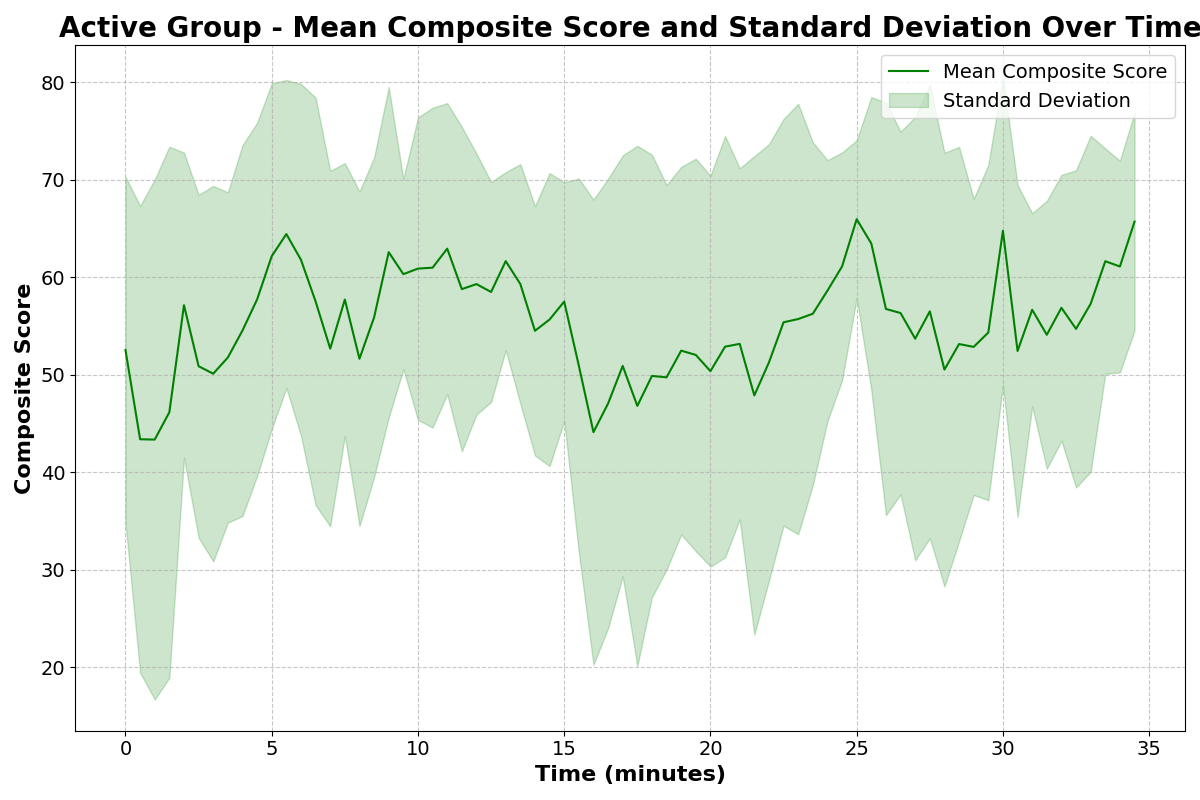
Fig. 7. Active Group: With the active group, the mean is slightly higher and the variance bands are narrower than the passive group. The active group achieved an overall mean composite score of 55.41 and a standard deviation of 18.81, with a total of 20,181 data points collected.
Qualitative feedback. A post-session questionnaire, adapted from the User Experience Questionnaire (UEQ), assessed effectiveness, intelligence, comfort, and fatigue with the SIT-UP system. Users in both the passive and active groups perceived the system as significantly more effective and intelligent compared to those in the control group. The productivity score showed minimal improvement, meaning users did not gain any superpowers while sitting upright. Comfort, fatigue and intrusiveness were rated less favorably in both intervention groups.

Table 1. Post-study questionnaire: Survey results from the three experimental groups.
Statistical tests. Four hypotheses were tested comparing mean composite scores during and after passive and active interventions to baseline. Wilcoxon paired statistical comparisons were conducted. tl;dr: No statistically significant conclusions. Here’s a rhyme:
Beeps and buzzes, a posture quest,
Stats said “Meh” to our behest.
P-values danced, but none impressed,
Our backs remained a slouchy mess.
The study highlights the complexity of posture intervention and the need for further research in this area.
Limitations. A major challenge was defining “good posture,” which varies among individuals. It is hard to mathematically codify and requires careful calibration based on the person being studied. A few study design constraints crept up too. Lack of within-comparison testing limited the direct comparison of participant responses. Participants may “try too hard” due to the awareness of being studied (Hawthorne effect). Script interruptions occurred occasionally due to a power supply issue, which were mitigated by resuming the study as soon as a team member found out. The vibration feedback method (using a phone instead of integrating it into a chair) was not ideal. The sample size was too small, especially the single-person control group. And lastly, the short-term nature of this study was a key drawback. Behavioral shifts only become more apparent if the system’s impact is assessed over a longer horizon, say, a month.
Synthesizing it all. If we learned anything, it is that building a posture correction system is complicated. Without intervention, posture tends to worsen over time, emphasizing the need for some external support. Passive interventions (sounds or vibrations) show mixed results. Some people respond better to certain types of reminders, suggesting that a one-size-fits-all approach may not work for everyone. A personalized, adaptive system could be more effective. Active desk adjustments seem to work better. However, frequent desk adjustments, while helpful, may mess with a user’s concentration. The key takeaway is that future posture correction systems should aim to balance effectiveness with user comfort.
Coda. This project was conducted as part of the Human-Robot Interaction class at Georgia Tech. Dr. Sonia Chernova supervised this project, and her TAs, Maithili and Karthik, helped facilitate it.